How to Track Your WordPress Form Performance with Form Vibes

You published a contact form. Submissions are coming in. But do you actually know if your form is performing well or whether it is getting better or worse over time?
Form Vibes Analytics shows you exactly how many submissions your forms are receiving by day, week, or month, so you can see trends, catch drops early, and understand what is actually happening with your form data.
This guide covers how to find and use the Form Vibes Analytics feature, how to read the charts, and what patterns to act on. If you are not yet saving submissions, see how to save your WordPress form submissions first.
Notes: No setup needed. If Form Vibes is installed, Analytics is already active and capturing data. Go to Form Vibes → Analytics and your submission history is already there.
Where to find Form Vibes Analytics
Form Vibes has two places where analytics data appears the dedicated Analytics page and the dashboard widget on your main WordPress admin screen.
The Analytics page
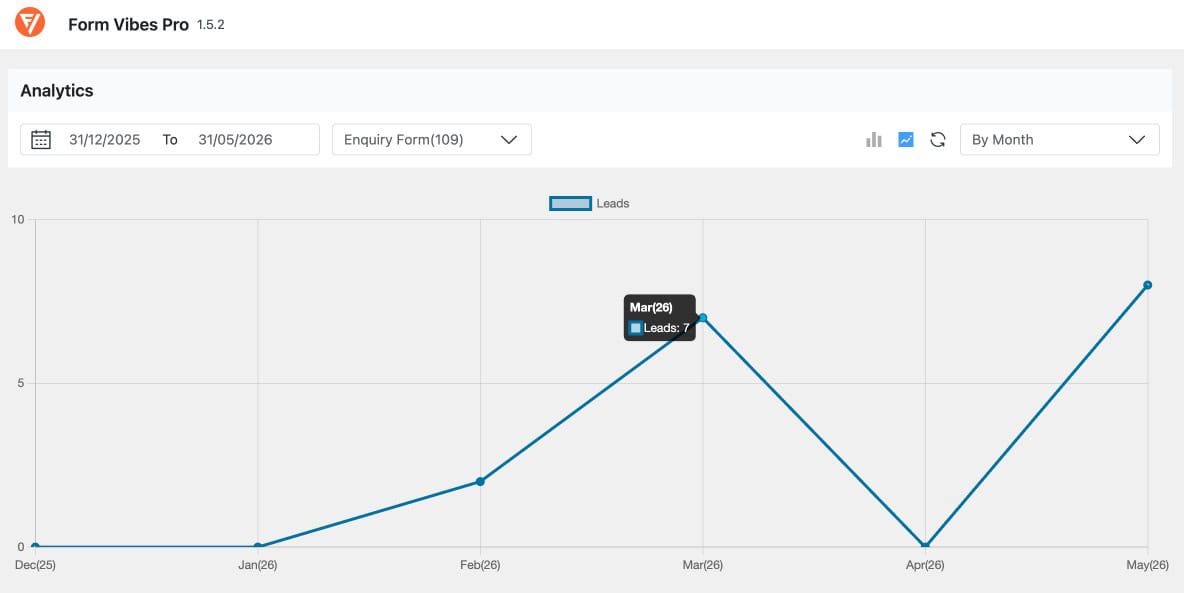
Go to Form Vibes → Analytics in your WordPress dashboard.
Three controls appear at the top:
- Date range picker – set a custom from and to date to define the period you want to analyse
- Form dropdown – select a specific form. The form name shows the total entry count in brackets for example “Enquiry Form (109)” so you can see the running total at a glance
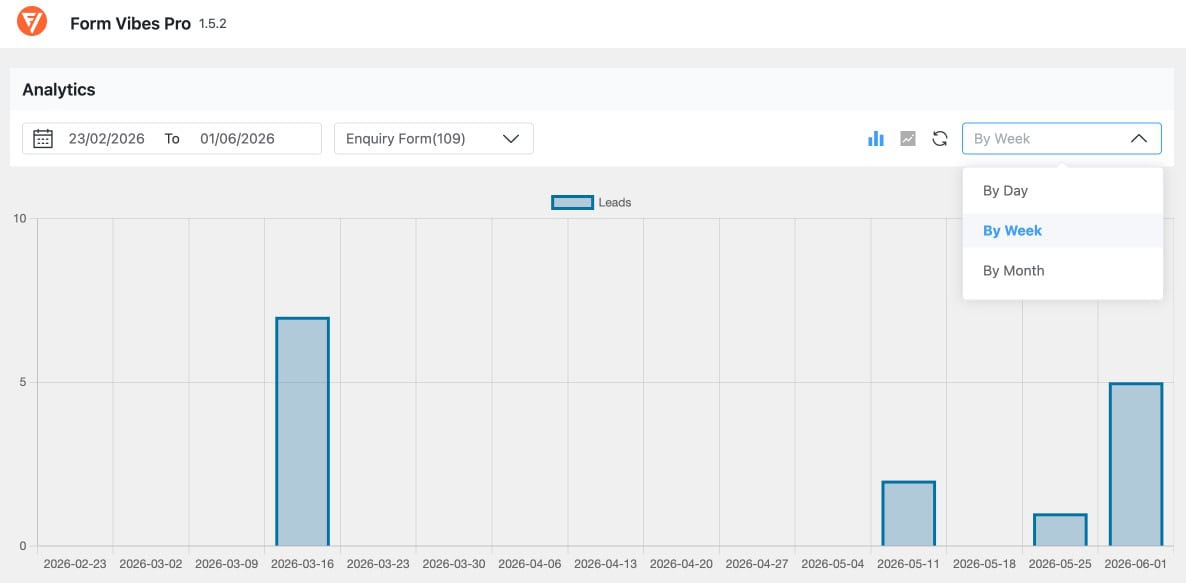
- Time filter – choose By Day, By Week, or By Month to control how the chart groups submissions
Two chart types are available. Switch between them using the icons in the toolbar:
- Bar chart – shows submission volume as columns per time period
- Line chart – shows the same data as a continuous trend line
Your selected date range, form, and chart type are all saved automatically, so the next time you open Analytics it shows exactly what you were looking at before.
Notes: Form Vibes Analytics is a free feature. Both the Analytics page and the dashboard widget are available on the free plan. No Pro upgrade needed.
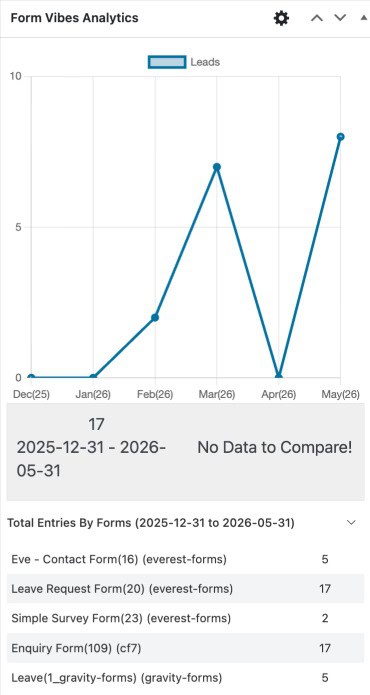
The dashboard widget
The dashboard widget lives on the main WordPress admin screen, the first page you see when you log in. It gives you a quick read on form activity without navigating to the Analytics page.
To enable it go to Form Vibes → Settings and turn on the dashboard widget toggle.
The widget shows:
- Form dropdown – select which form to view
- Date Range – set the period to analyse
- Filter – By Day, By Week, or By Month
- Line chart – submission trend for the selected period
- Total count – total submissions in the selected date range shown below the chart
- Total Entries By Forms – expandable section showing submission count per form for the selected period
Form Vibes captures every submission automatically and shows your trends in a free analytics dashboard, works with WPForms, Elementor, Gravity Forms, and more. Free to install.
How to read the charts
The bar chart and line chart show the same submission data in different ways.
Use the bar chart when you want to compare specific periods was March better than February, or did submissions increase after a campaign? Each bar height is the submission count for that period.
Use the line chart when you want to see the overall direction, is form performance going up, going down, or staying flat? A rising line means more submissions over time. A sharp drop followed by a flat line means something changed and did not recover.
Tips: Use By Month for a high-level overview across several months. Switch to By Day to pinpoint exactly when a spike or drop happened.
What patterns to look for
Three submission patterns are worth acting on when you spot them.
Your submissions suddenly dropped
You were getting a steady number of submissions and then in one week or month, the number fell sharply.
This usually means something broke. A plugin update may have affected the form, the page may have moved to a new URL, or a design change may have pushed the form out of place.
The quickest check: go to the form page yourself and submit a test entry. If the form works and you receive the notification, the form is fine, the drop may be traffic-related. If the form does not submit correctly, you have found the problem.
Your submissions are slowly going down
Submissions have not dropped overnight but have been getting lower week by week or month by month.
This usually means fewer people are reaching the form either the page is getting less traffic, the content on the page has become outdated, or something about the form itself is putting people off.
Switch to By Week view in Form Vibes Analytics and look at how far back the decline started. That helps you connect it to something that changed around that time.
You had a big spike but it never repeated
One period, a single week or month had much higher submissions than usual, then things went back to normal.
This is a good sign. Something drove more people to your form during that period a campaign, a blog post, a social share, or someone linking to your page.
Switch to By Day view to find exactly which days the spike happened. Then think about what was different on those days. Whatever worked once can work again.
Important: Form Vibes Analytics shows how many people submitted your form in a given period. It does not show how many visited the page without submitting.
Conclusion
Form Vibes Analytics gives you a clear picture of how your forms are performing over time without leaving your WordPress dashboard. Check the last three months now using Form Vibes → Analytics and see whether your submission trend is going up, down, or flat. That one view tells you more about your form performance than a year of checking individual emails.
If you need to get your submission data out of WordPress for reporting or sharing, the guide on how to export your form submissions covers every export option in Form Vibes.
Start tracking your form performance today
Form Vibes captures every submission and shows your trends in a built-in analytics dashboard. Free to install, works with many popular WordPress form plugin.
Frequently Asked Questions
Common questions about tracking form submissions in WordPress.
Is Form Vibes Analytics free?
Yes. Both the Analytics page at Form Vibes → Analytics and the dashboard widget are available on the free plan. No Pro upgrade is needed to track submission trends and volume over time.
What does Form Vibes Analytics show?
Form Vibes Analytics shows submission volume, how many entries your form received per day, week, or month. It displays a bar chart and a line chart, both switchable from the same view. It shows submission counts, not page views or visitor numbers.
How do I enable the Form Vibes dashboard widget?
Go to Form Vibes → Settings and turn on the dashboard widget toggle. The widget then appears on your main WordPress admin screen and shows a trend chart, total submission count, and a per-form breakdown for your selected date range.
Why is my Form Vibes Analytics showing zero submissions?
Three common causes: Form Vibes was not active when the submissions came in (it only captures submissions made after installation), the wrong form is selected in the dropdown, or the date range does not cover the period when submissions were received. Adjust the date range and check the form selection first.
Can I view analytics for multiple forms at once?
The Analytics page shows one form at a time, select the form from the dropdown to switch between them. The dashboard widget also shows one form at a time but includes a Total Entries By Forms section below the chart that shows submission counts for all your forms for the selected date range in one view.


Leave a Reply